> For the complete documentation index, see [llms.txt](https://docs.marpledata.com/docs/llms.txt). Markdown versions of documentation pages are available by appending `.md` to page URLs; this page is available as [Markdown](https://docs.marpledata.com/docs/marple-insight/user-manuals/analysis/plot-types/time-series/signal-settings.md).

# Signal Settings

When selecting a signal, or a signal group, you can change the appearance of this signal in the plot.

* Change the Style of the signals.

<div align="center"><figure><img src="/files/eWl3Rea2tA2ID2wifIJ0" alt="" width="375"><figcaption></figcaption></figure></div>

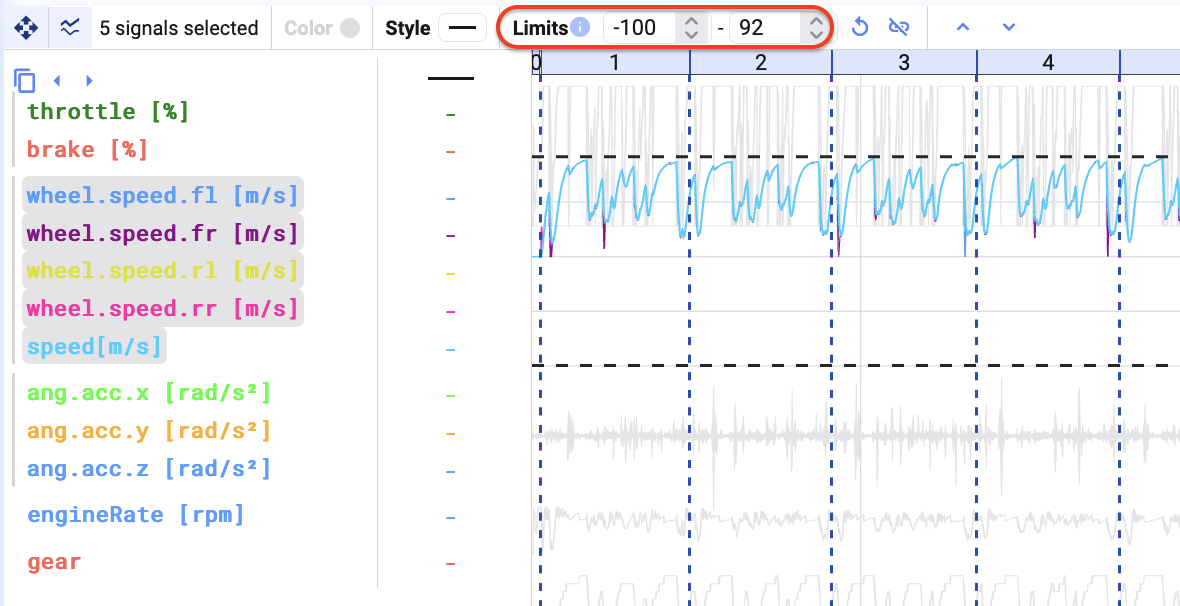
* Change the limits of the signals in the group (think the minimum and maximum of the y-axis). Changing the limits will apply to the entire group ;

<div align="center"><figure><img src="/files/aERnkFN8xqJwXrzWKyUH" alt="" width="375"><figcaption><p>Change the limits of the signal</p></figcaption></figure></div>

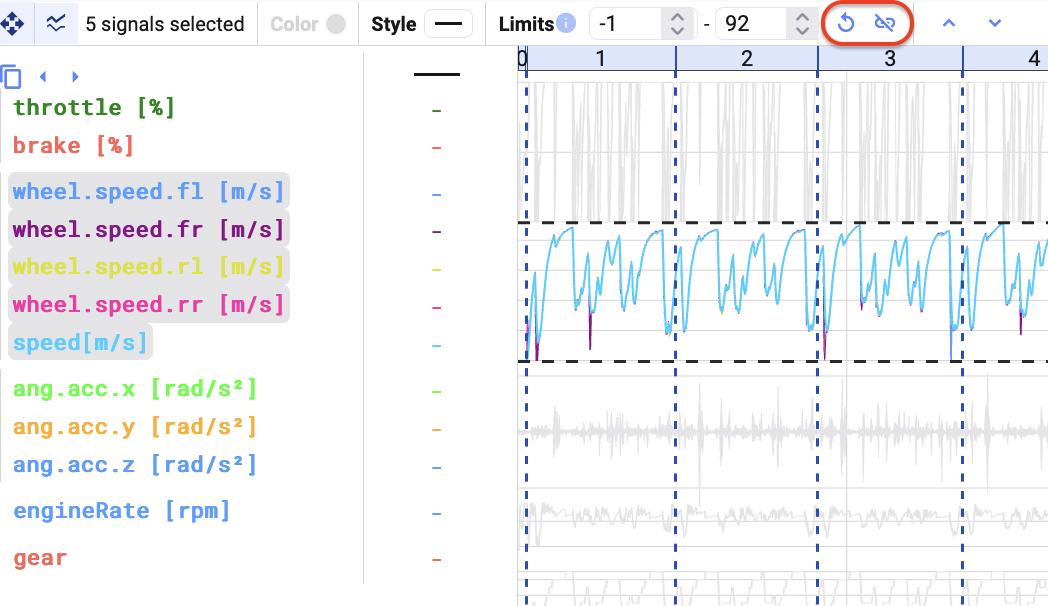
* Reset the limits for the group, or ungroup the signals.

<div align="center"><figure><img src="/files/owiHU7kiUn96eZpO0Tc5" alt="" width="375"><figcaption><p>Reset limits or ungroup the signals</p></figcaption></figure></div>

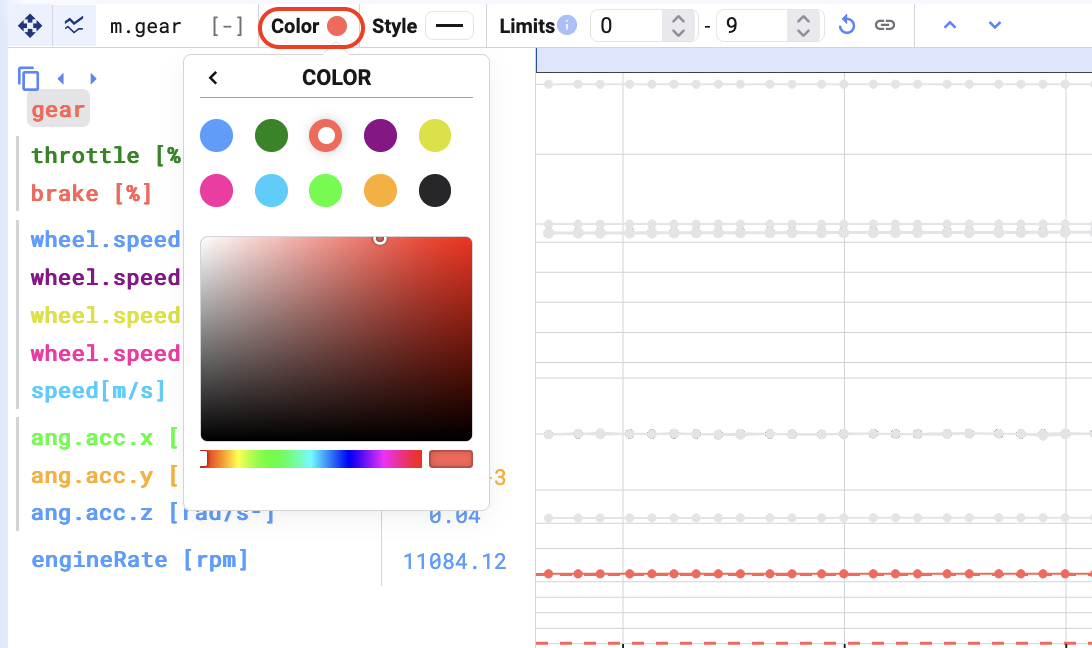
* When selecting an individual signal, you can also change the color of the signal.

<div align="center"><figure><img src="/files/U8BCcB3Lz8N2SOmKXeMQ" alt="" width="375"><figcaption><p>Change color of signal</p></figcaption></figure></div>

* Hide signal from plot, but keep it visible in the cursor values table.<br>

  <figure><img src="/files/quuVTzTW7nHT9ZeOpO78" alt=""><figcaption></figcaption></figure>

## Show or Hide Signal Y-Axes

By default, if you add multiple signals to a plot that do not all belong to the same group (or do not have the same limits), the multiple y-axes will be hidden.

If you want to show these axes again, click the **Show all axes** button in the toolbar.&#x20;

<figure><img src="/files/mnxnosh1anN77mNrs1FL" alt="" width="375"><figcaption></figcaption></figure>

&#x20;