
Influx DB
Connect with an InfluxDB time series database
Note: InfluxDB has multiple versions. Marple supports InfluxDB 2 and 3 (IOx), the two latest and most used versions. Our integration for v3 is relatively new, so let us know if you have a different experience than v2 at [email protected].
⚠️ InfluxDB 1.x is not supported. Please migrate to a newer version of InfluxDB to use Marple.
Contents
The documentation below is structured in two parts
Set up (only first time)
Visualising and saving data (finding the right data)
Note: some more advanced Marple features are not yet available for InfluxDB data. We'll be adding them in future releases.
1. Set up
Preparing your Influx database
To get started with InfluxDB, you will need the three credentials:
URL: the web link, like http://influx.mycompany.com
Token: a connection token which looks like a long random string
Organisation: the organisation where your data belongs to
Custom HTTP headers: only if your InfluxDB requires these
If you have an IT department you might need to ask them. If you have access to the InfluxDB web application, you can obtain these credentials yourself with the steps below.
If you don't like to read, here's a video that covers this "1. Set up" part.
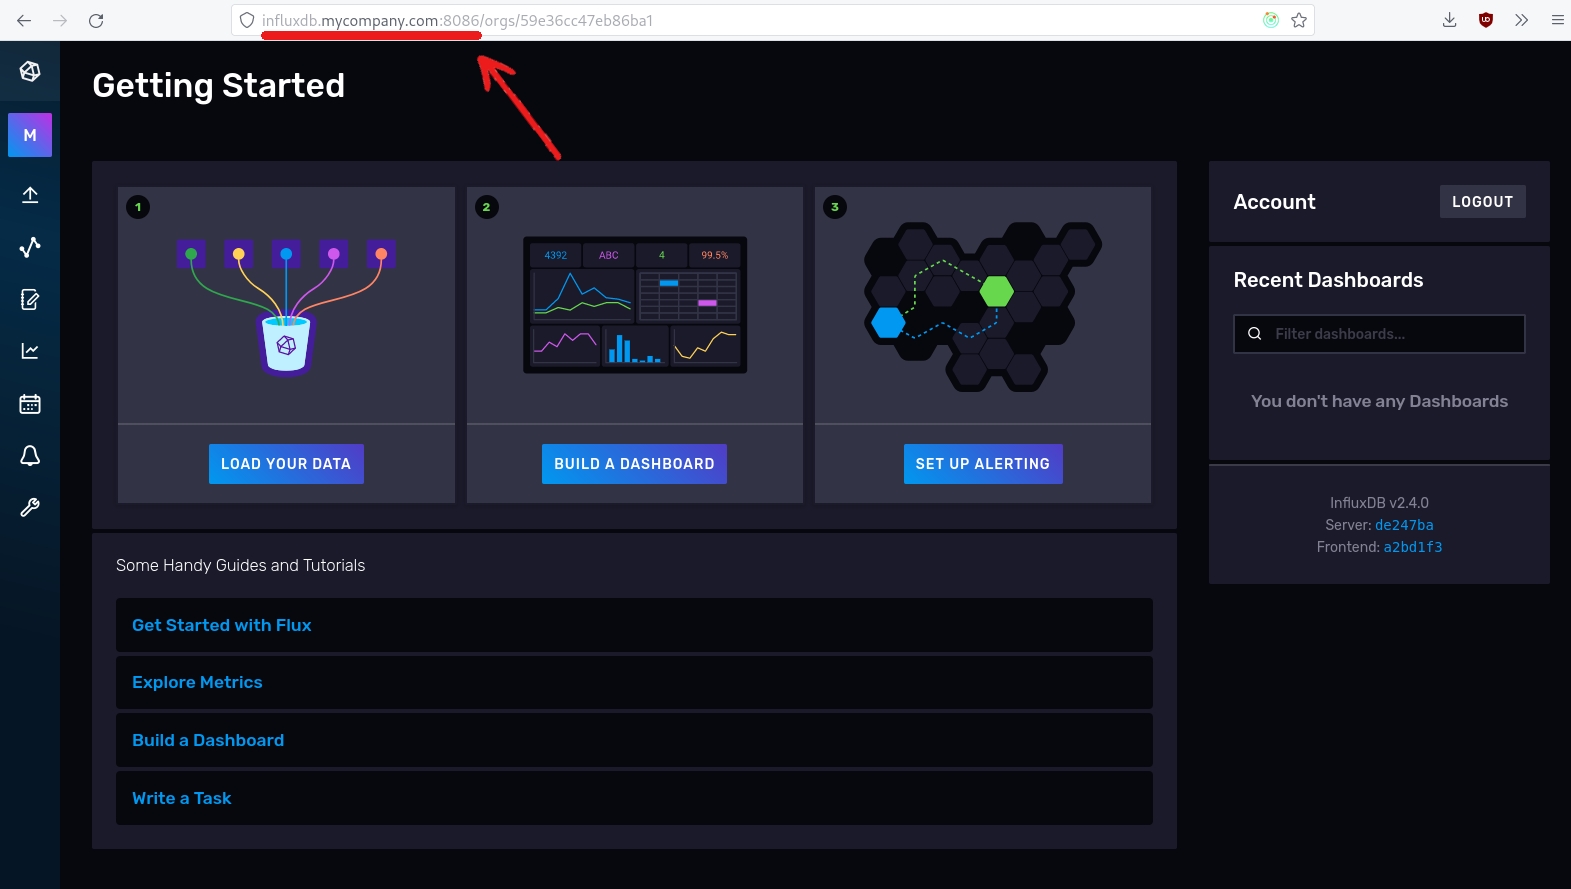
1. URL
The URL can be read from your browser bar. Be sure to only include the part before the first slash ("/"). Some examples of valid URL's:
http://influx.mycompany.com
http://influx.mycompany.com:8086
http://ec2-3-66-214-234.eu-central-1.compute.amazonaws.com:8086
Often the URL will include the port 8086. Make sure to include it (and the colon ":")
⚠️ Important: make sure that the URL is accesible from outside your company network/VPN. You can try this by accessing the URL using your phone on cellular network. If this is not the case, you will need the help of IT to set up port forwarding.
2. Token
Use the load data menu to access the "API tokens" section.
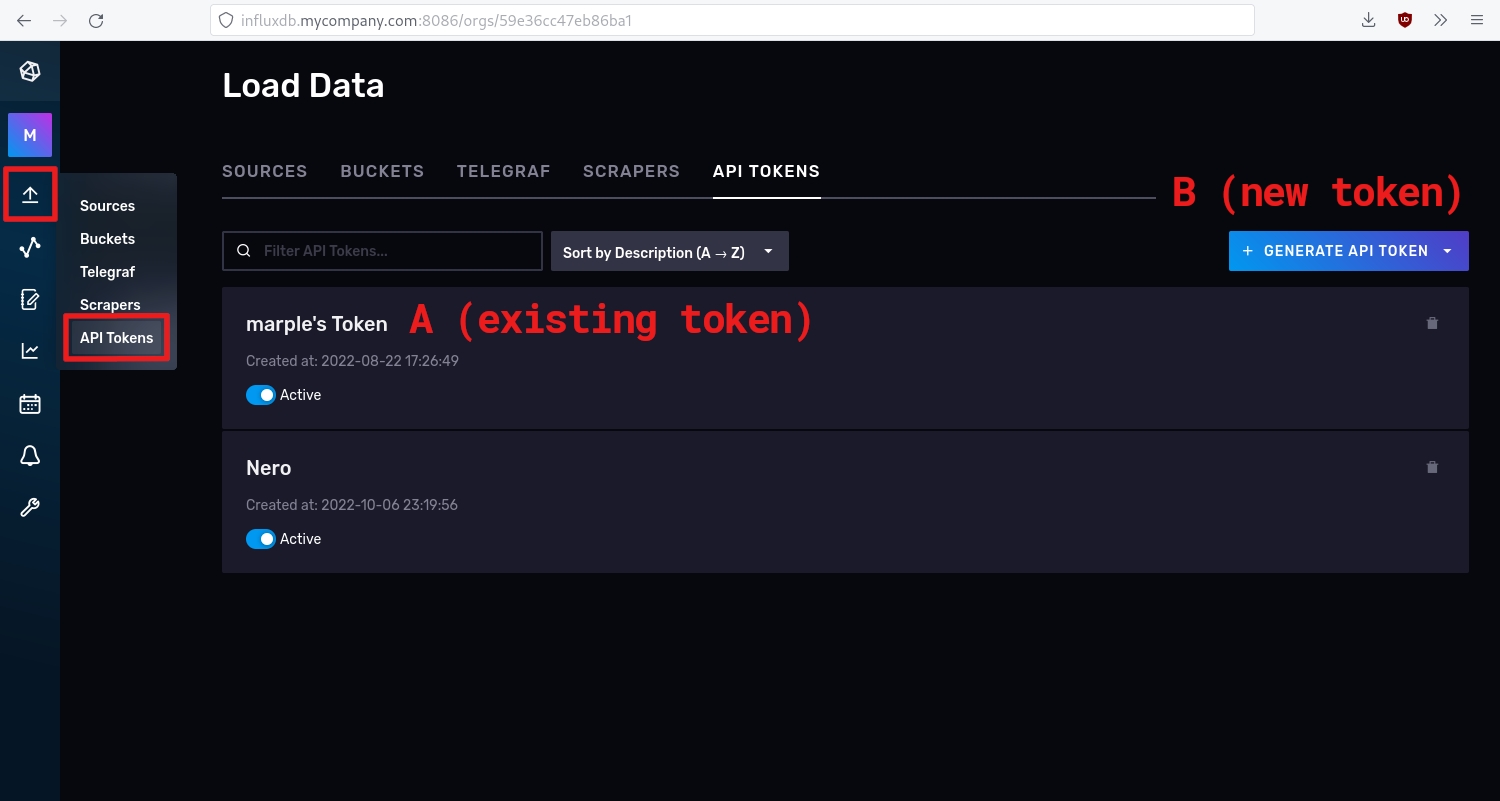
You can choose to reuse an existing token (A) or to generate a new token (B).
The most secure option is to create a new token:
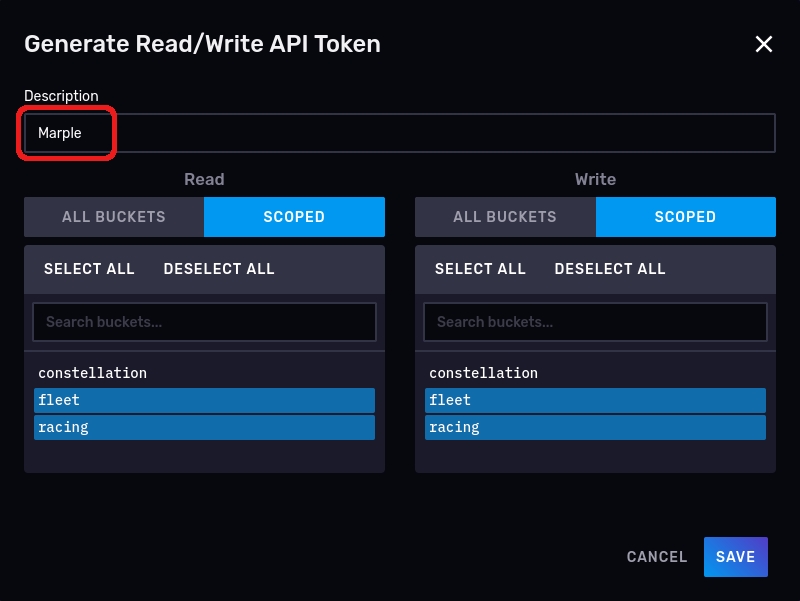
Click "Generate api token" and choose "Read/Write API Token"
Enter "Marple" as the description
Select what buckets you want Marple to be able to access (or select "all buckets")
Save the token
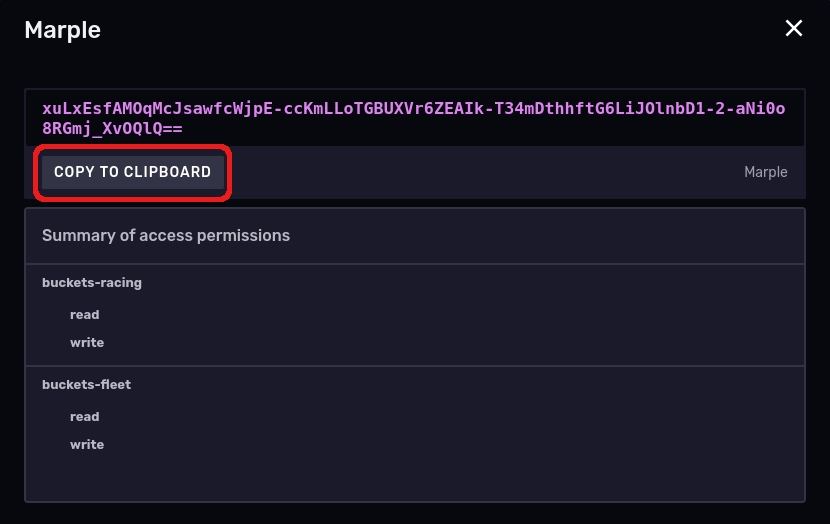
Click the token to open it
Copy the value to the clipboard, you'll need it to set up Marple
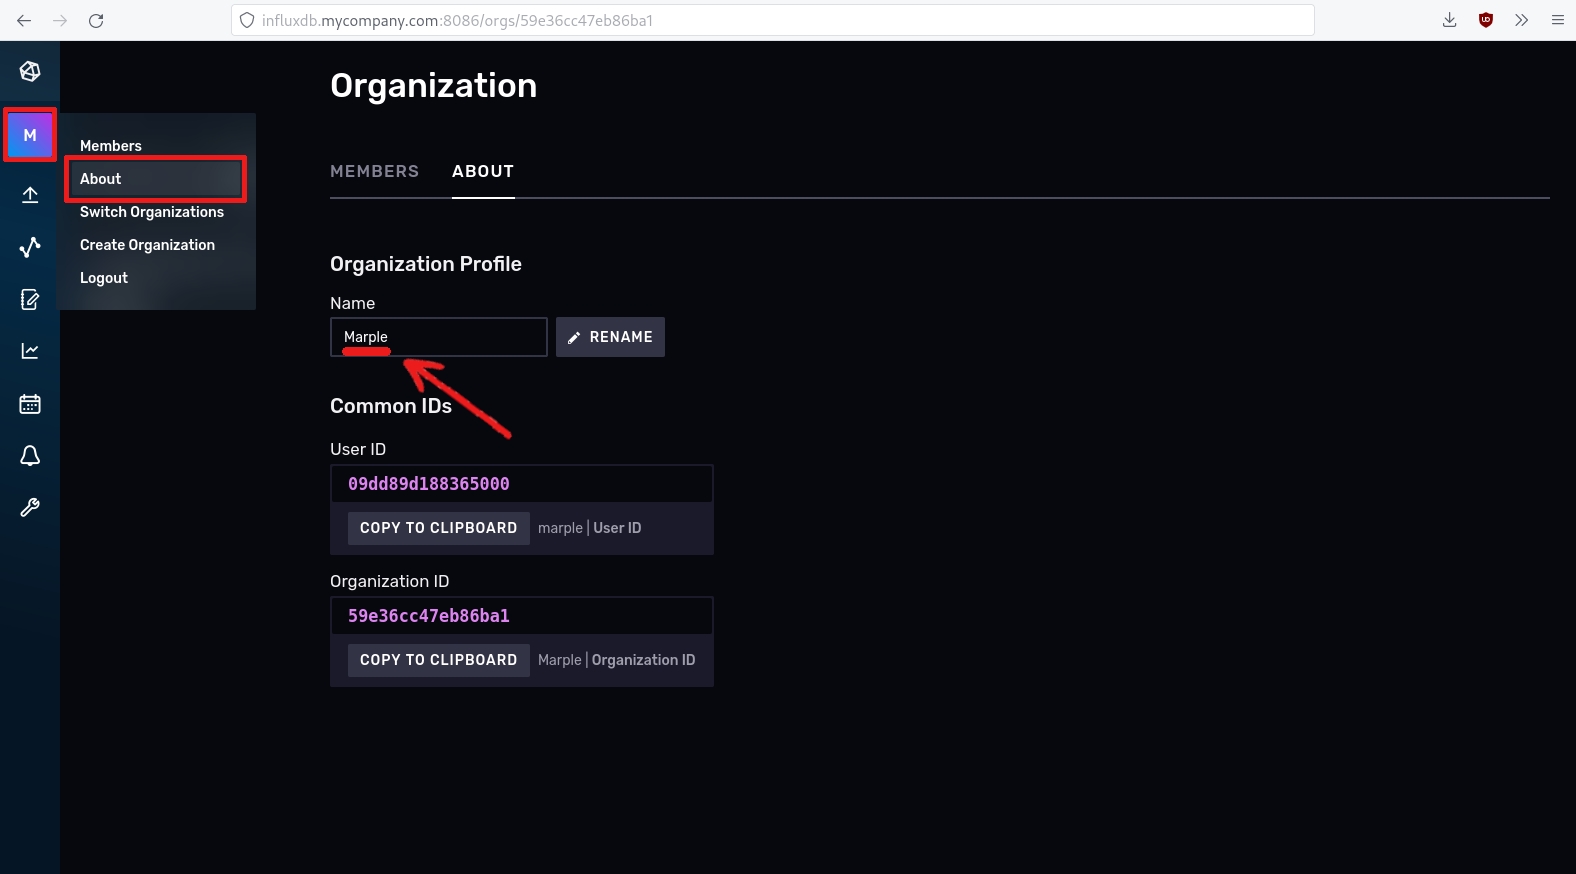
3. Organisation
The organisation can be found in the about section.
4. Custom HTTP headers
Optionally, you can add custom HTTP headers to the InfluxDB connection. If you need those, make sure you have the header names and values ready.
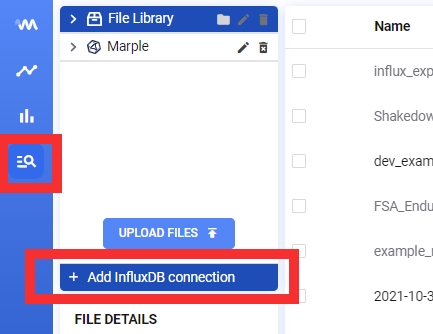
Making the connection
Create a new InfluxDB connection in the data library.
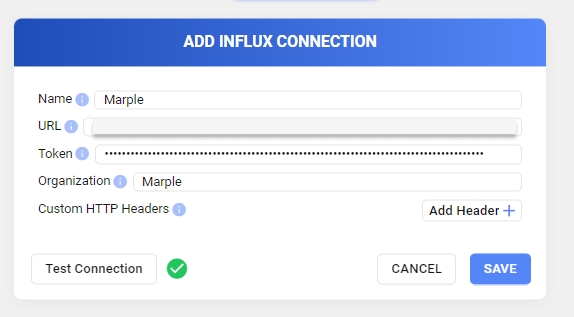
Enter the credentials (URL, token, organisation, custom HTTP headers) obtained from the InfluxDB application or your IT administrator. You can choose an easy to remember name for this connection.
Click "Test Connection" to check if the credentials work. If all is well, save the connection.
2. Visualising data
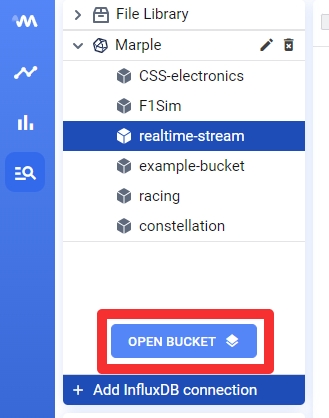
Selecting data
After your connection is all set up, it's time to visualise the data in your buckets. Go to the library, select the bucket of your choice and press OPEN BUCKET.
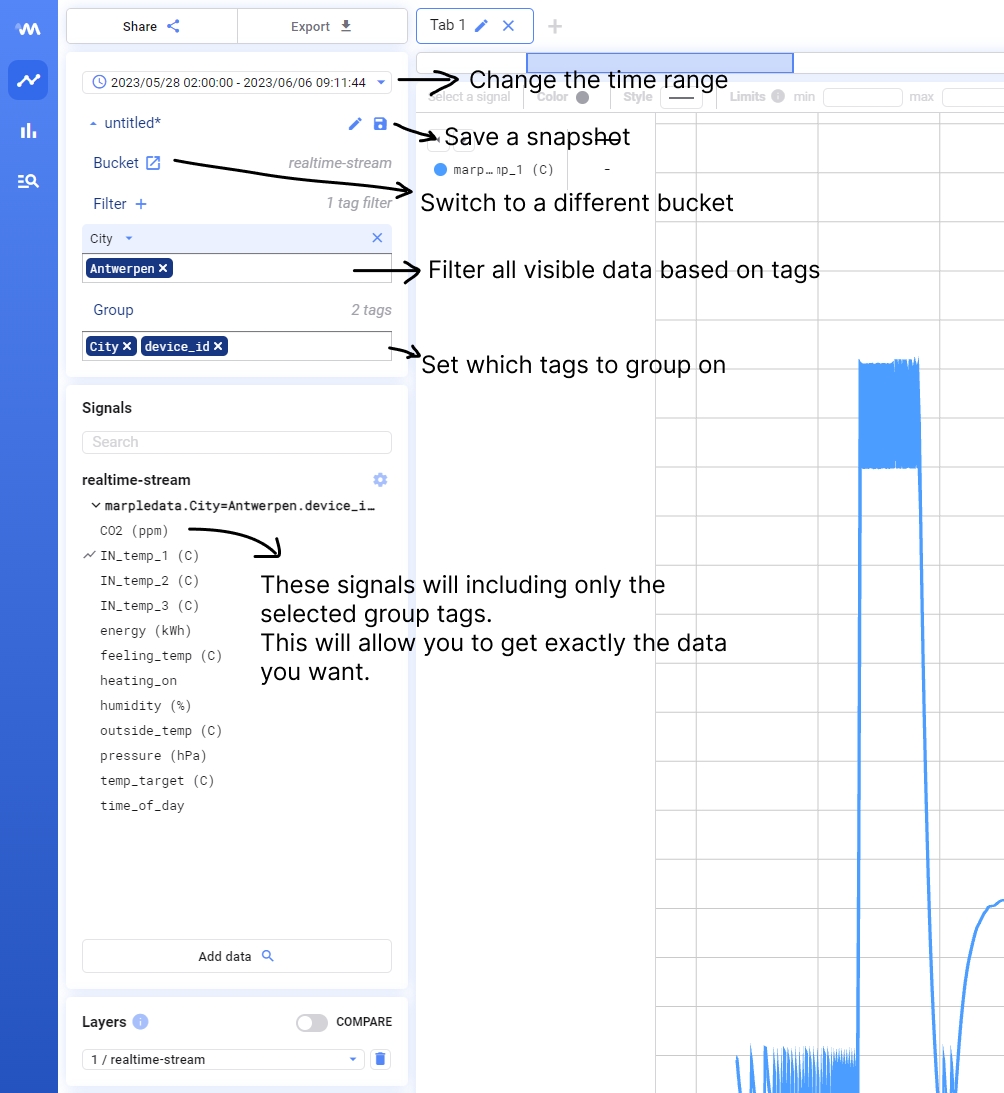
In the visualisation view, you can configure the data:
Select the bucket: switch to a different bucket if you like
Setting time range: pick this as narrow as possible for a nice result
Filter on tags: narrow down by selecting a bucket and specific tags
Group by tags: select which tags your data should be grouped on
Save your data settings in a snapshot: reuse it later without having to specify the settings again
Hint: visualisations will have the best result when you narrow down by selecting enough tags. If you leave the tag filtering open, your snapshot can contain multiple datasets layered on top of each other.
Once in the visualisation tab, you unlock the same Marple features as for files. You can drag signals to plot them, create share links, etc. See the analysis documentation for more information.
Save data settings in snapshots
Influx databases can contain a lot of data. Often, you only want to visualise a small part of that at once. A snapshot lets you choose a small part of the data.
You can think of snapshots as files. They appear in the library and are shared with your team members. They can also have metadata.
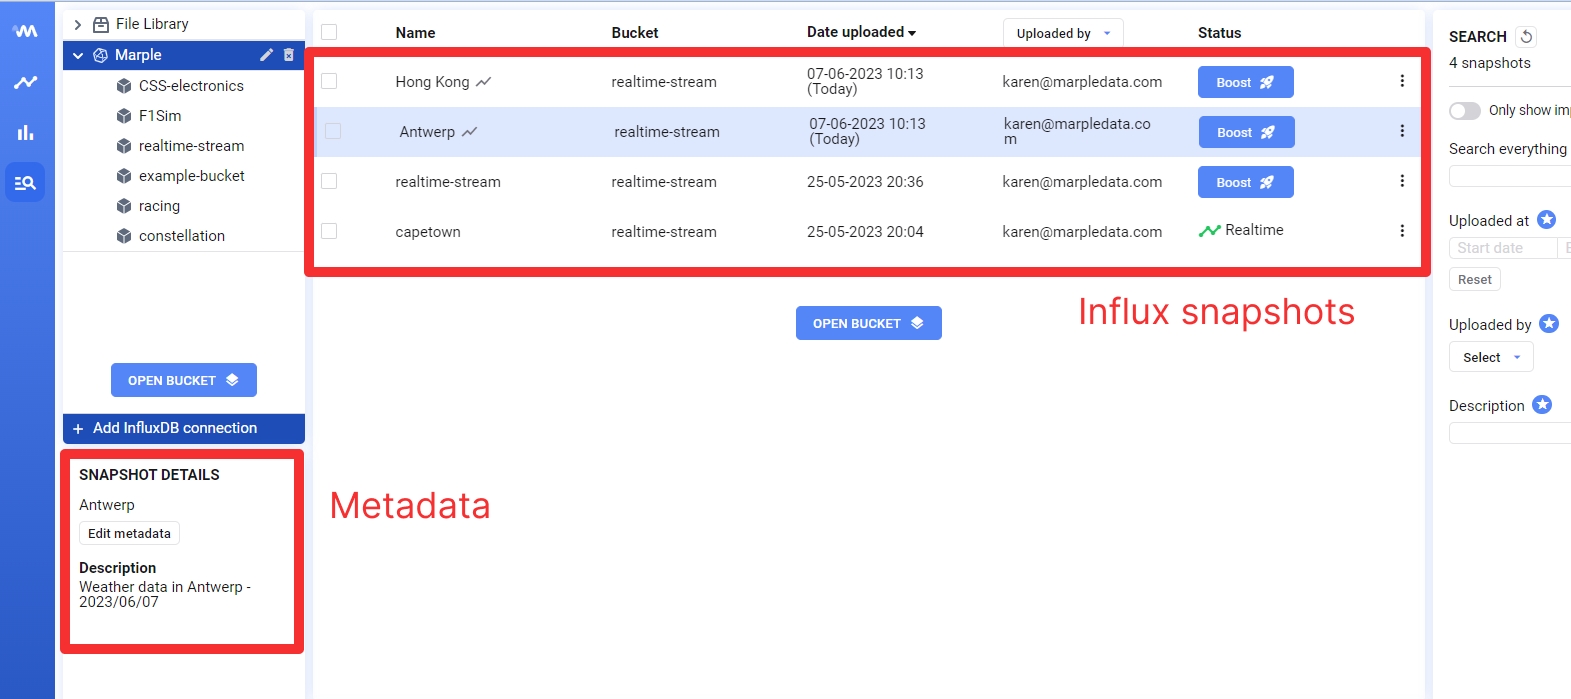
Visualising snapshots works the same as you would with files:
Click the checkbox (or double click the snapshot)
Click "Visualise"
Last updated