Projects
Use projects to save your work
What is a Project?
Projects in Marple are a way for the user to save a configuration/layout/workbook/template/.. that can be used the next time you log in to Marple. Projects can even be shared between different team members!
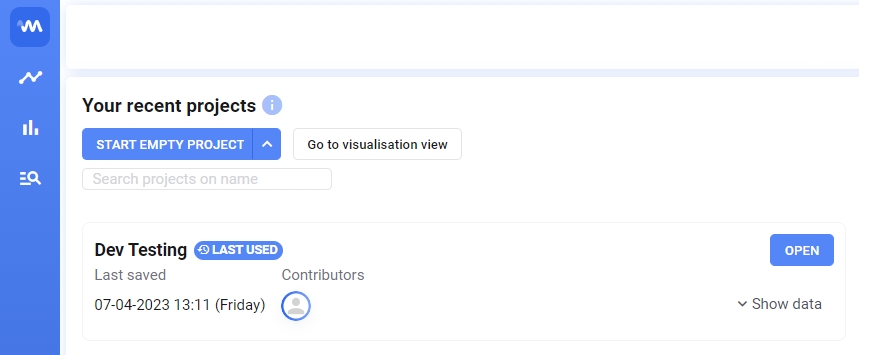
There are two places where you can find Projects. The first one is on the home page of Marple.

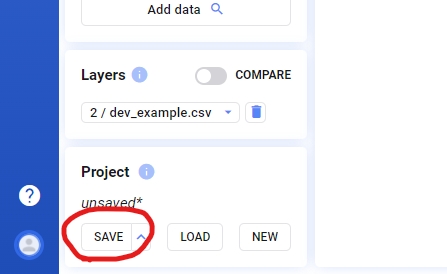
The second place is in the Analysis part of Marple. Here you can also save a Project!

When to use Projects?
Projects come in very handy if you need to analyse a lot of different data sets that come from the same source or logger. Projects save the layout of your plots, the signals you selected, the relative order of the signals, .. Once you've created a Project, you can instantly analyse all other data sets or new data sets! Projects also save calculated signals. If you open a Project with calculated signals with a new data set, these calculations will also be applied to the data automatically.
Read-only projects
In general, projects can be edited by everyone in your workspace. This makes it very easy to collaborate with colleagues.
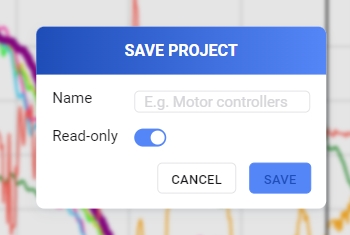
It is possible to make a project read-only. This means you can still edit and save that project, but everyone else in your workspace can only view your project. Changes from other users will not be saved.
To make a project read-only, use the read-only toggle when saving a new project.

Recent projects
In the home view, you will be able to see all Projects from yourself and your team. There is some extra information given about the Project as well such as:
The last saved date and time
Contributors
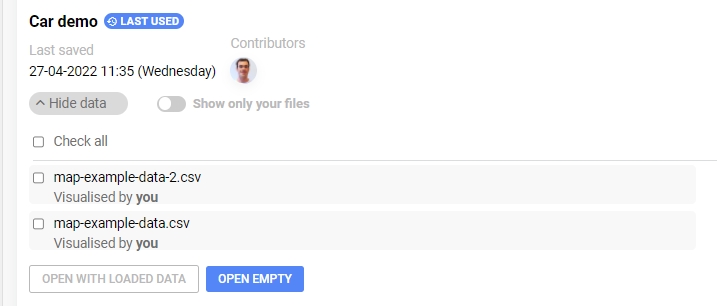
Data sets that are linked to this Project
Whether a project is read-only

In this view you will be able to open a Project, either empty or load it with some data visualised by you or one of your team members.
Limitations
Projects have their limitations.
If you want to load a data set in your Project that does not have the same signal names, Marple will not be able to make the link and will show no data.
Projects do not save the time range you are looking at. When you open a Project with some data, it will always start from the top-level zoom.
Organising and prettifying projects
A well-organised project makes it a lot easier to interpret your data. The video below shows a few tips and tricks on how to clean up your plots and make them beautiful.
Last updated